Quantum Cloud Group of BAQIS Observed Entanglement Transition of Pseudo-random Mixed States
2023/04/19
The Quantum Cloud group of BAQIS, collaborated with the Institute of Physics, Chinese Academy of Sciences, University of California, Santa Barbara and Zhejiang University, used 15 fully connected superconducting qubits to observe the phenomenon of entanglement phase transition in random mixed states for the first time. On April 8, 2023, the achievement was published in Nature Communications under the title "Observation of entanglement transition of pseudo-random mixed states".
Random quantum states are those that are uniformly distributed throughout the entire Hilbert space. Implementing and observing such states in experiments poses a significant challenge. Google's claim of quantum supremacy relies on the computational complexity of sampling random quantum states in classical computers. Random states have also garnered considerable interest in black hole physics. Recent theoretical works have suggested that an entanglement phase transition would occur in random states if they can be split into a system and an environment, and the ratio between the two is altered. However, characterizing this type of entanglement phase transition requires entanglement negativity, which is difficult to measure for multi-qubit systems in experimental settings. Due to the implementation difficulties surrounding random multi-qubit states, researchers have yet to observe the entanglement phase transition in random states during experiments.
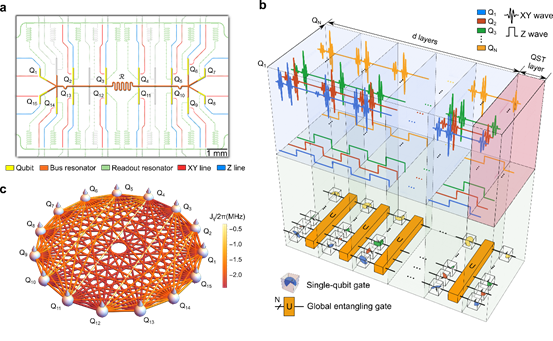
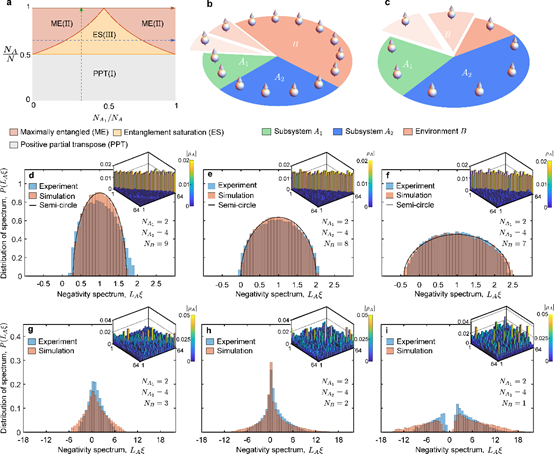
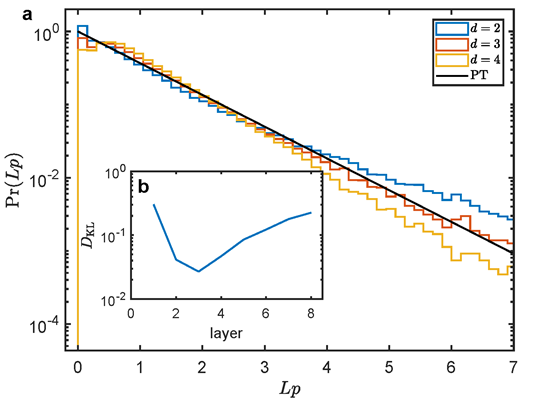
Our research group employs a fully connected superconducting quantum processor containing 20 qubits to implement random quantum states using pseudo-random circuits. These circuits utilize global entangling gates that rely on the full-connected architecture and random single-qubit logical gates. Owing to the strong entangling power of these global entangling gates, a shallow pseudo-random circuit can generate a random state with at most 15 qubits in experiments. By leveraging six-qubit quantum state tomography, we obtain the density matrices of the system and calculated the negativity spectrum and log negativity between two subsystems of the system. Our experimental data demonstrates that the distributions of negativity spectrum are dependent on the size of the environment and system, exhibiting features such as the positive partial transpose (PPT) phase, the maximally entangled (ME) phase, and the entanglement saturation (ES) phase, enabling us to detect entanglement phase transitions. The ME phase and ES phase can be distinguished based on the behavior of log negativity. When the size of the environment is smaller than a threshold, the entanglement between two subsystems satisfies the volume law proposed by Page and is proportional to the size of the smaller subsystem. After increasing the size of the smaller subsystem, the log negativity will saturate and enter the ES phase. Additionally, we sample the output bit-string probabilities of pseudo-random circuits to check their randomness. By comparing the distribution of output in experiments with the Porter-Thomas distribution, we verify that the layer of circuits in experiments is enough to generate highly random states.
This research is completed through the collaboration of the following authors: Tong Liu, a Ph.D. student from the Institute of Physics, Chinese Academy of Sciences; Heng Fan, Kai Xu, Dongning Zheng, Zhongcheng Xiang, Kaixuan Huang, Xiaohui Song from the Quantum Cloud group of Beijing Academy of Quantum Information Sciences and the Institute of Physics, Chinese Academy of Sciences; Shang Liu, a Postdoctoral researcher from the University of California, Santa Barbara; and Hekang Li from the Zhejiang University. This work is supported by the National Natural Science Foundation of China, Beijing Natural Science Foundation and Strategic Priority Research Program of Chinese Academy of Sciences.

Fig. 1. Quantum simulator and experimental pulse sequences. a False-color optical micrograph with highlighting various circuit elements. Qubits (yellow) are labeled from Q1 to Q15 and the central resonator (red) capacitively coupled to all qubits is labeled as . Each labeled qubit can be controlled by its XY line (red) and Z line (blue), and measured through the readout resonator (green). b The pulse sequences of a pseudo-random circuit and its equivalent gate model. is a global entangling gate and each cubic box is a random single-qubit gate. c The schematic representation of the effective coupling graph of 15 qubits with an equal detuning MHz from the central resonator.

Fig. 2. Phase diagram and negativity spectra. a Analytical phase diagram of reduced density matrix when . Green arrow indicates a path along which the negativity is plotted in Fig. 3a. Blue or brown arrows indicate paths along which the negativity is plotted in Fig. 3b. b, c Cartoons of subsystems and environment. Green, blue, and orange sectors represent subsystems , and environment , respectively. d–f Negativity spectra sampled from pseudo-random circuits where , and , ,or . g–i Negativity spectra sampled from pseudorandom circuits where , and , or . One of the density matrices sampled from circuits with different sizes of environment is shown in the northeast corner of d–i.

Fig. 3. Averaged logarithmic negativity . The error bars represent standard error of the mean over circuit instances. a Fix and , then decrease from to . b Fix or and increase from to . When , the negativity approximately obeys volume law. In contrast, the negativity is saturated from to when .

Fig. 4. Histograms of output bit-string probabilities sampling from pseudo-random circuits for nine qubits and KL divergence. a Three histograms are sampled from two, three and four layers of circuits. Dark solid line represents the PT distribution. b The KL divergence between the sampling distribution and the PT distribution over layers.
 中文
中文 Email
Email QCloud
 Log in
